Post by Seanstone on Feb 8, 2012 2:54:13 GMT -5
There has been a little bit of interest in the past with people wanting to know how to use excel to keep fishing logs. So I made a little write up. Hope it helps. If someones interested I can make another post that's more advanced later. I'm always glad to help those who are interested.
Over the last three years Rylan and myself have kept quite extensive fishing logs. It started out rather simple, but quickly became a very complex system. We are constantly finding things that we want to keep track of for each trip. Last year I began recording barometric pressure, wind speed, wind direction, etc. so that I could compare each weather related condition to other values such as fish caught, or points made.....see The Fishing Point System post. However, keeping a fishing log does not have to be this complex, and for most people a simple journal will work just fine. In the next few paragraphs I will explain some of our methods for keeping a fishing log.
The most simple method of keeping a log is the above "journal" method. One simply takes a journal along with him or her every trip and writes down what he or she wants to remember about the trip. I have found that this method tends to work with people that fish less than 30 times a year, any more than that and the pages begin to deteriorate, the ink runs, and its hard to compare multiple trips at once. Another way one can keep a journal is to write each log/trip in his or her phone. I have a droid smart phone and I often times use the "Quick Office" feature to keep track of basic fishing conditions, time spent fishing, and my catches. I will then convert this data to my primary log when I get home after each trip.
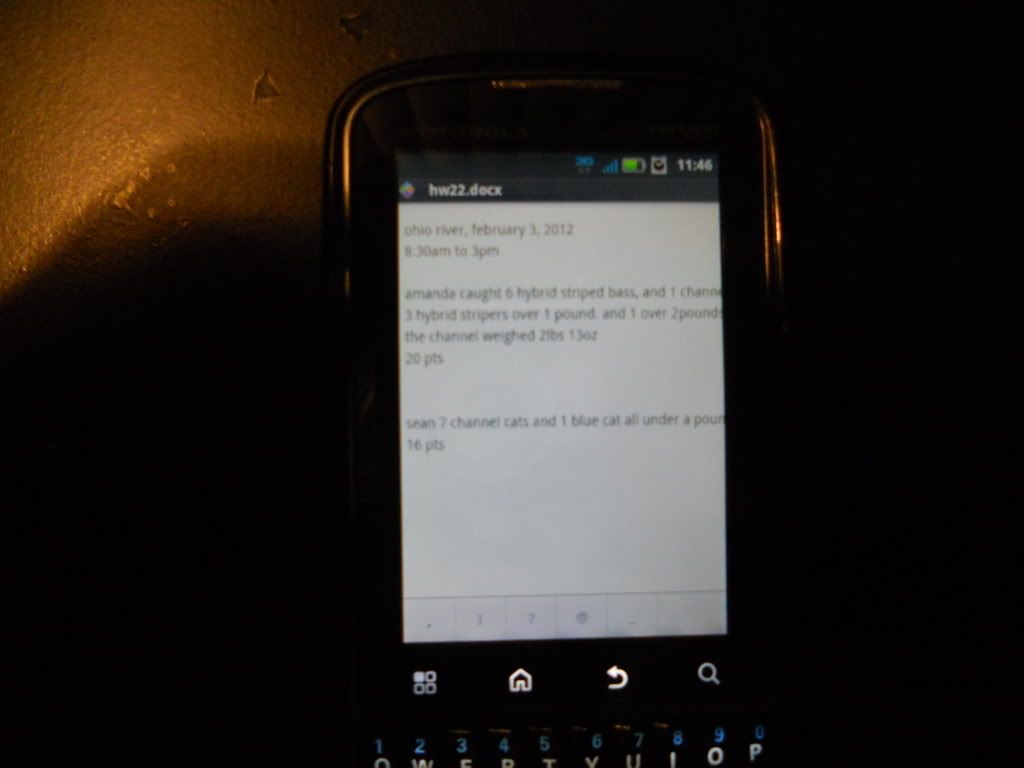
Droids "Quick Office" use to keep a log.
The second method of keeping a log is using a word/document processing software such as Microsoft Word, Or Notepad to keep track of each trip. The first year Rylan and I kept fishing logs, this was our primary format. We'd simply add small paragraphs for each trip with consistent formats. One example would be as follows:
7-21-2008
Rocky Fork Lake (Fishermans Wharfe)
5pm to 3am, 10 Hours, Cloudy with a light sprinkle around Midnight
11 Bluegill, 2 Carp (5lbs 8oz, 7lbs 20z) 3 Channel Cats (2lbs 2oz, 4lbs 7oz, 4lbs 12oz) 1 Largemouth Bass
31.5 points (An Old point system total. Once again refer to the point systems post)
Bait used: Nightcrawler, Wheatie Balls, Cut Bluegill
7-28-2011
Ohio River
5pm to 1:30am, 8.5 Hours, Clear
1 Channel Cats (8lbs 10oz) 3 Drum (2 less than 1lb.,1lb 5oz)
15 Points
Bait Used: Nightcrawler, cut shad
After a year of fishing we typically had 80 or so trips and we found that by using this method it was possible to compare trips but a lot of hand calculating had to be done. Therefore we eventually switched to our current log format....Microsoft Excel.
As mentioned above we currently use Microsoft excel as our primary program to keep and analyze our fishing logs. We have found that by using a row as an individual fishing trip we can compare our data much more easily. The columns allow each individual factor of a given trip to line up with the same factor of other trips. This is helpful when comparing lets say number of fish caught between location a and location b. Microsoft Excel is also a very powerful program when it comes to computing formulas, analyzing patterns, etc. Since this post is just basics, we'll cover the essentials, and then the more complex things in another post.
To begin lets start by opening Microsoft Excel, my version is 2010, so many of yours may look slightly different. However the processes are the same. (Feel free to follow along if you have Microsoft excel.) At the bottom right hand corner there is a slider that allows you to zoom in and out, for this log I chose to use a small number of columns so I zoomed in quite a bit.
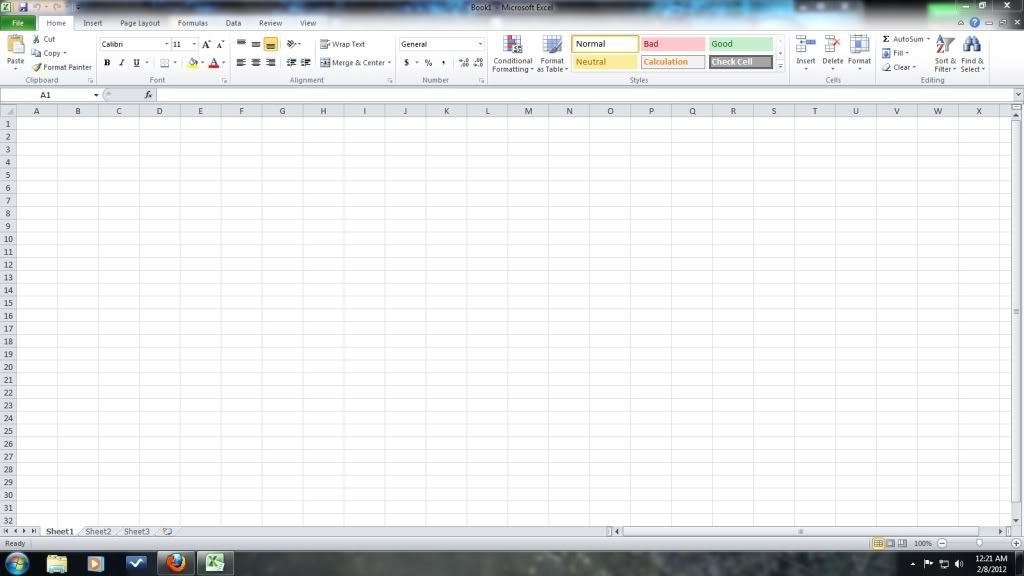
Empty Spreadsheet in Excel
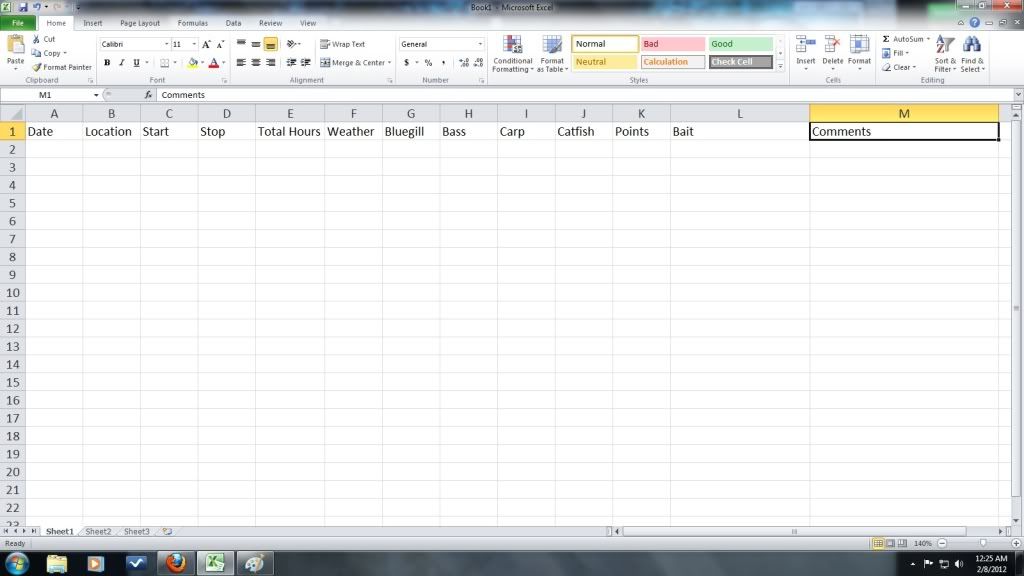
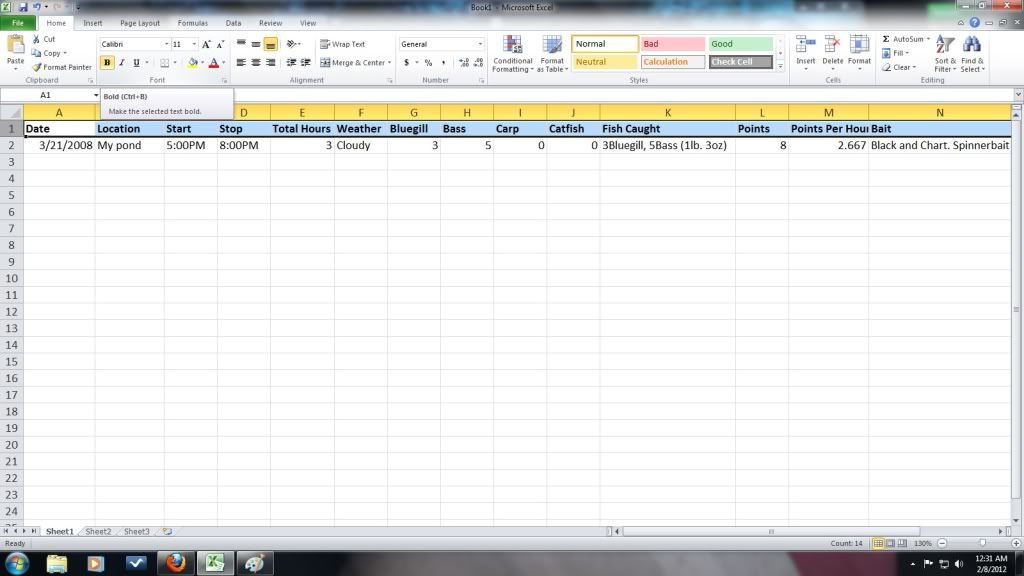
To begin start by adding titles to the first row, line of horizontal cells. For this walk-through I chose a few simple titles. Starting from left to right they are as follows: Date, Location, Start, Stop, Total Hours, Weather, Bluegill, Bass, Carp, Catfish, Fish Caught, Points Per Hour, and Bait. To add these titles simply click on the first collumn and begin typing, when your done hit the right arrow on your keyboard or select the next cell. Your spreadsheet should now look something like this.
The next step is to begin by filling in a fishing log. For the fist trip I chose to fill in the following data: 3/21/2008, My Pond, 5:00pm, 8:00pm, 3, Cloudy, 3, 5, 0, 0, 3 Bluegill, 5 Bass (1lb. 3oz), 8, 2.667, Black and Chart. Spinner Bait.
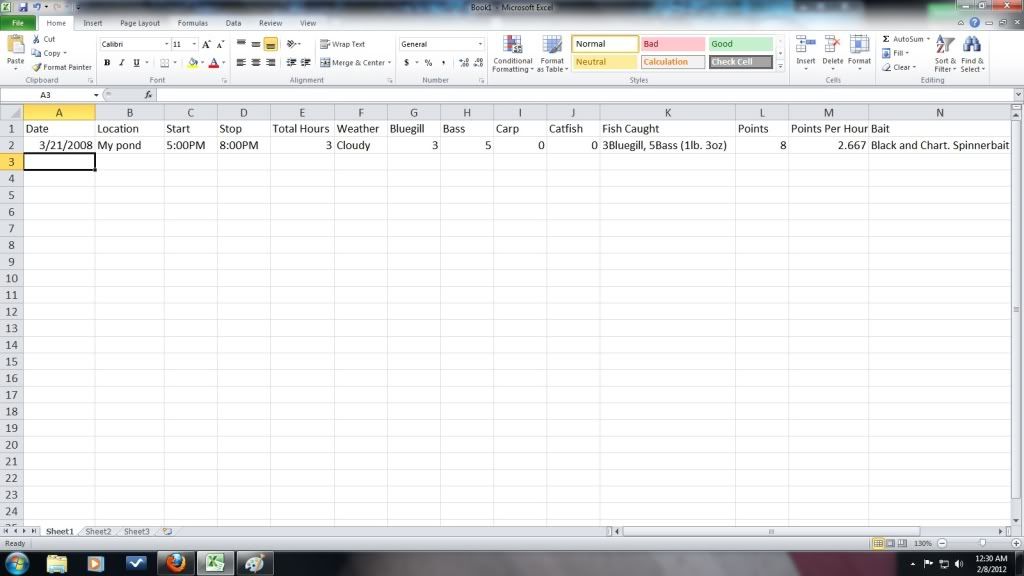
This needs a little explanation, under the fish caught title the cell should read 3 Bluegill, 5 Bass (1lbs. 3oz) This means that all bluegill were smaller than a half a pound....requirement for points, and that all but one bass was smaller than a pound. I use this format so that I don't have to keep track of all of the fish's weights, and in turn make the cell way longer than it has to be. The Points Per Hour column reads 2.667, this number is derived from the number of points divided by the number of hours spent. For this calculation I always use a calculator or do the math on paper. I choose not to use a formula here because it takes more time to create the formula than it does to actually just go ahead and do the math.
Now that we have a log in, we can begin to see that a few stylistic changes should be made. I chose to bold my tittles.To do this select the first row, this can be achieved by clicking on the "1" on the left had side to the left of the "Date" cell. Then above in the tools you will notice an area where you can change font/etc. here you will find the bold tool. It's represented by a large "B". You can also achieve this by selecting the desired cells and holding "Ctrl" and B on your keyboard. This is known as a short cut command. Here's where the bold function is located, and what your screen should now look like.
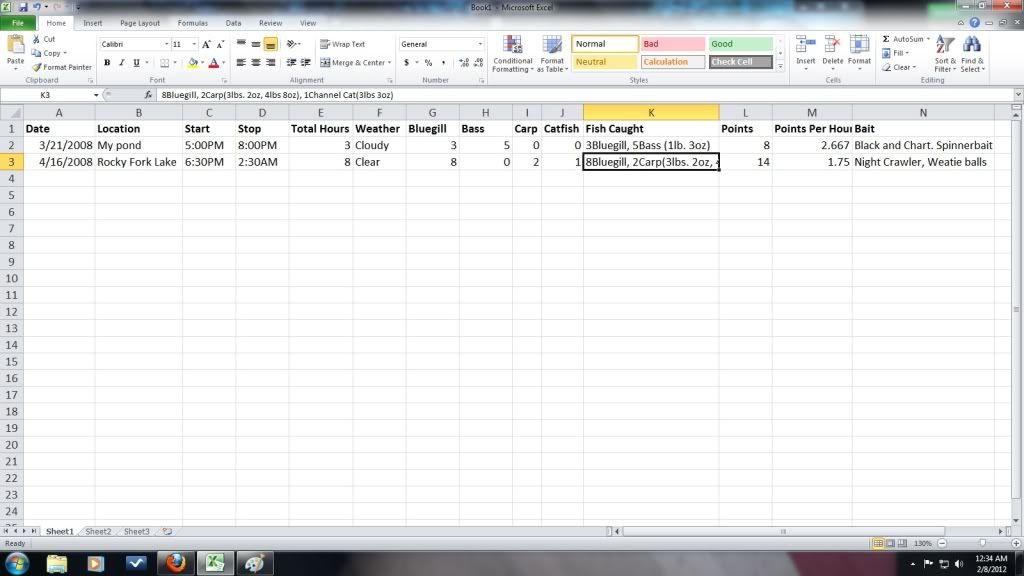
Now you can begin to add your next log. For this log format the cells as following: 4/16/2008, Rocky Fork Lake, 6:30pm, 2:30AM, 8, Clear, 8, 0, 2, 1, 8 Bluegill 2 Carp (3lbs. 2oz, 4lbs, 8oz) 1 Channel Cat (3lbs 3oz), 14, 1.75, NightCrawler, Wheatie balls. Here you will begin to notice that your Fish Caught column is getting cut off, to help with this try using abbreviations. I chose to use this instead: 8BG, 2CP(3lbs2oz, 4lbs8oz), 1CC(3lbs 3oz) Note the # sign can also be used instead of lbs. for those who catch more fish than others, or choose to keep track of more weights than others. Here is what your screen should look like at this point.
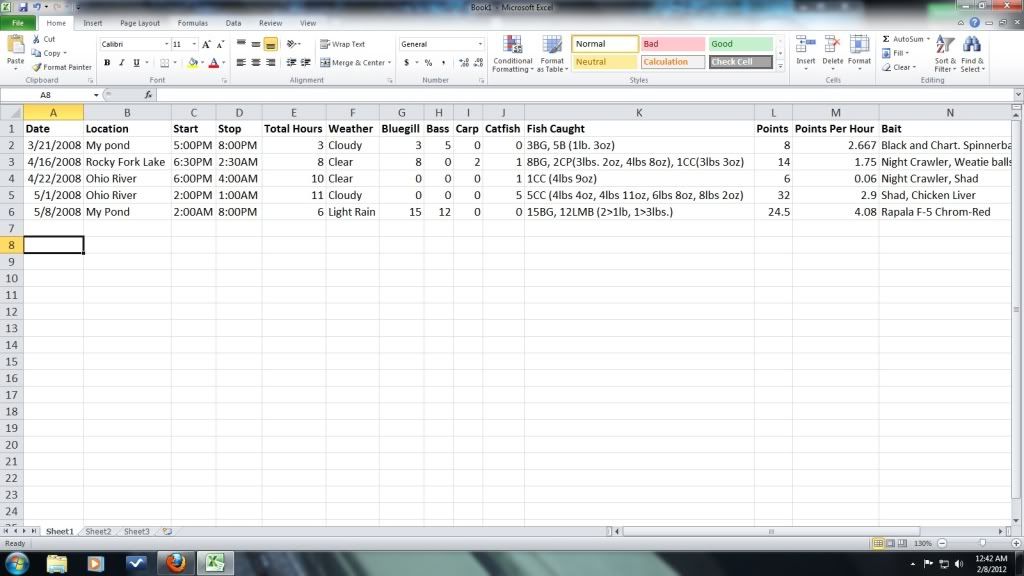
Now go ahead and format the next three trips to match the following image.
The next step is to utilize the functions of Excel to do a few calculations for your log. Here we will use formulas to obtain the total hours spent this year, total bluegill, total bass, total carp, total catfish, total points, and total points per hour. To begin start by adding a title for the column. In cell A9 Type the word TOTAL. Now move and select the cell E9, this should be the cell directly under the total hours column. Now click the formulas tab in the tool bar, and then select the autosum function. Shown below.
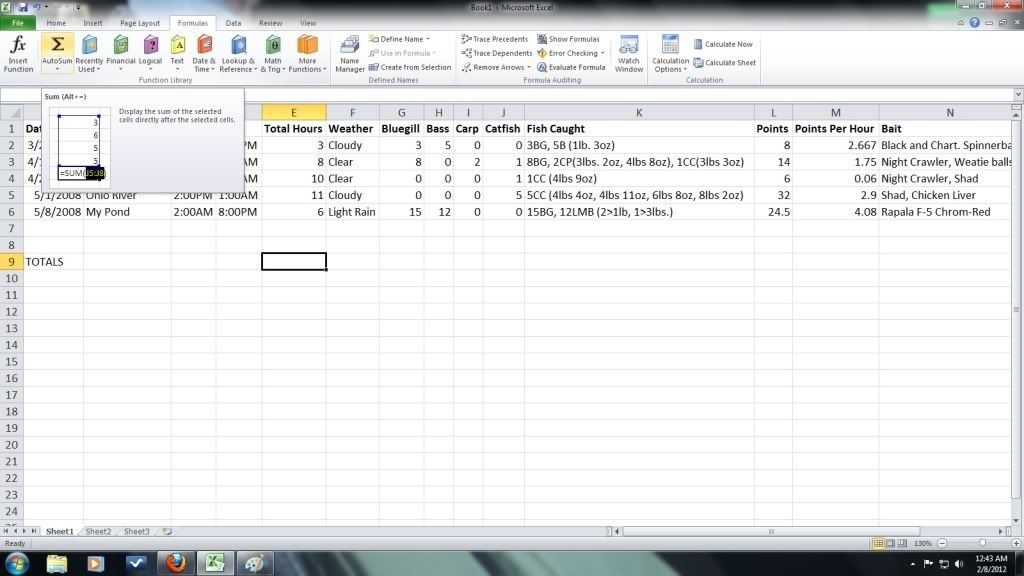
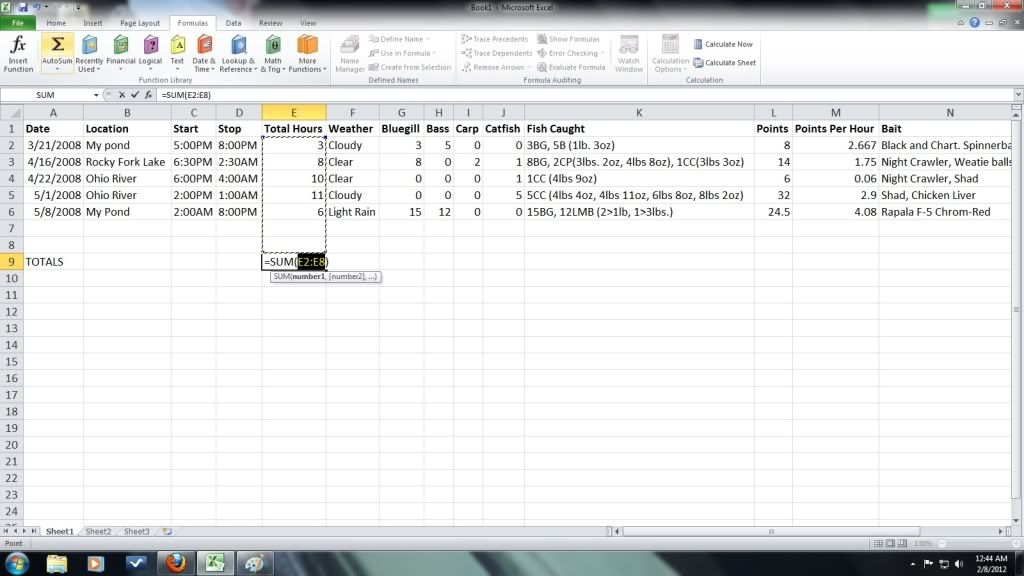
Once you click the autosum function your screen should look like this. The cell should now read =SUM (E2:E8). This formula is telling the program to add all of the numbers in columns E2 through E8.
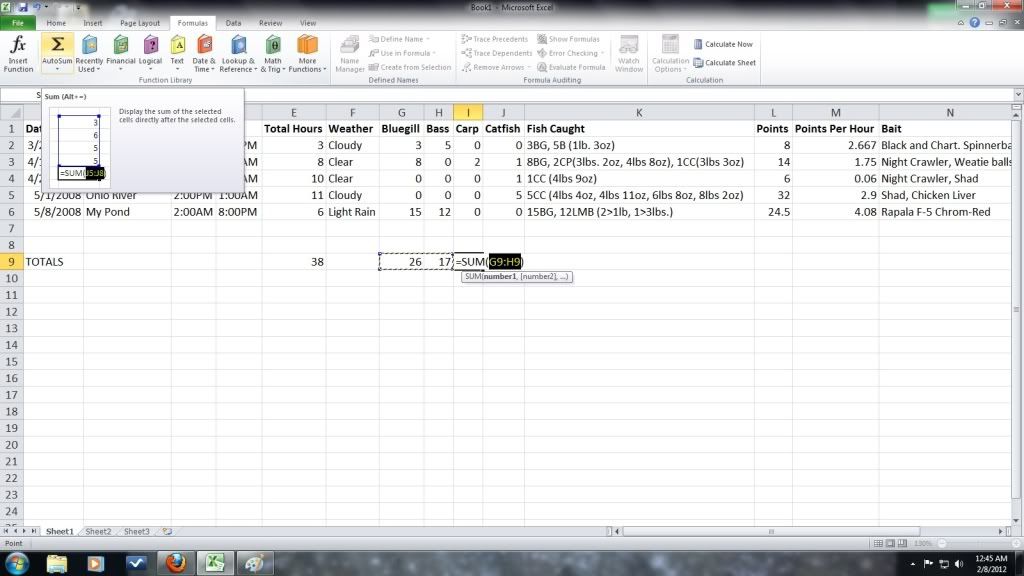
Hit enter and the cell should now read 38. Note if you put the word hours after the number in the cells the computer will not recognize the number and will give an invalid output. Now move to cell G9 and select the autosum function again. Hit enter and your cell should now read 26. Do the same for the Bass column. Now move to the Carp column, you'll not here that when you select the auto sum feature it will opt to sum the row 9 totals, this is just the computers way of trying to be helpful. Picture shown below. Simply highlight the cells you want to select instead. Do this by dragging your mouse pointer to cell I2 and left clicking, holding the left clicker of the mouse drag the pointer to cell I8 and release. Hit enter and your cell should read =SUM (I2:I8), or 2 for the total carp.
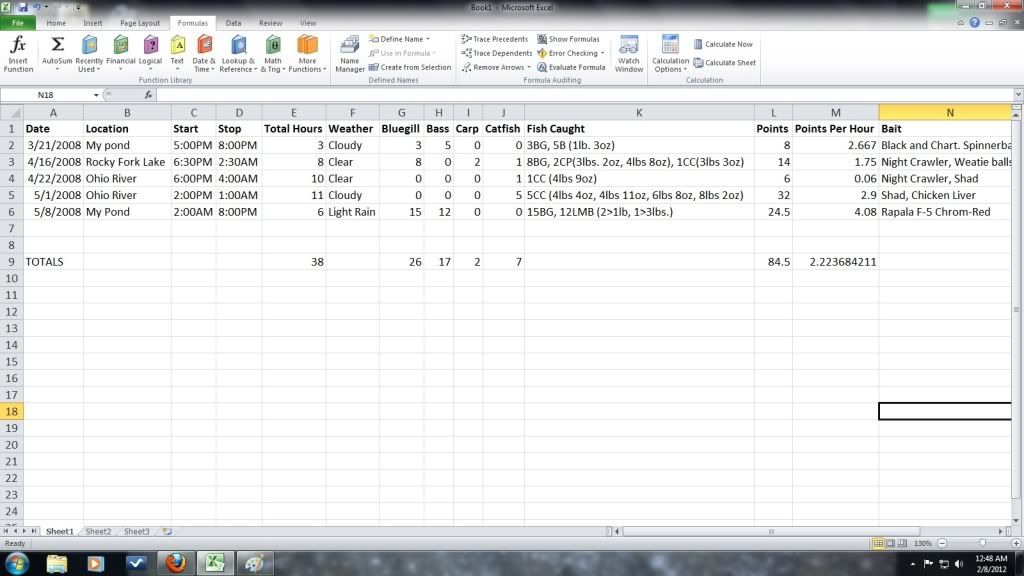
Now do the same for the catfish column and the points column. When you get to the Points Per Hour column you will have to use a different formula. Summing the points per hour will give you a huge number instead of an average. Instead select cell M9 and hit the = sign. This tells the program that you want to now create a formula. Now select the total points cell, L9 and hit the / key. Then select the total hours cell, E9 and hit enter. You have just told the program to divide the total points by the total hours you have spent, thus giving you an average. Your cell should now read 2.223......
Now you have a basic idea of a few of the calculations Microsoft Excel can make, thus saving the angler time and allowing him to fish more. On this small scale it would be easy to do hand calculations, but imagine doing calculations for 113 trips and 16 separate species. That is precisely how many trips and species I logged last year. It can become very monotonous, and makes me appreciate programs such as Microsoft excel that much more.
Thanks,
Sean
Over the last three years Rylan and myself have kept quite extensive fishing logs. It started out rather simple, but quickly became a very complex system. We are constantly finding things that we want to keep track of for each trip. Last year I began recording barometric pressure, wind speed, wind direction, etc. so that I could compare each weather related condition to other values such as fish caught, or points made.....see The Fishing Point System post. However, keeping a fishing log does not have to be this complex, and for most people a simple journal will work just fine. In the next few paragraphs I will explain some of our methods for keeping a fishing log.
The most simple method of keeping a log is the above "journal" method. One simply takes a journal along with him or her every trip and writes down what he or she wants to remember about the trip. I have found that this method tends to work with people that fish less than 30 times a year, any more than that and the pages begin to deteriorate, the ink runs, and its hard to compare multiple trips at once. Another way one can keep a journal is to write each log/trip in his or her phone. I have a droid smart phone and I often times use the "Quick Office" feature to keep track of basic fishing conditions, time spent fishing, and my catches. I will then convert this data to my primary log when I get home after each trip.

Droids "Quick Office" use to keep a log.
The second method of keeping a log is using a word/document processing software such as Microsoft Word, Or Notepad to keep track of each trip. The first year Rylan and I kept fishing logs, this was our primary format. We'd simply add small paragraphs for each trip with consistent formats. One example would be as follows:
7-21-2008
Rocky Fork Lake (Fishermans Wharfe)
5pm to 3am, 10 Hours, Cloudy with a light sprinkle around Midnight
11 Bluegill, 2 Carp (5lbs 8oz, 7lbs 20z) 3 Channel Cats (2lbs 2oz, 4lbs 7oz, 4lbs 12oz) 1 Largemouth Bass
31.5 points (An Old point system total. Once again refer to the point systems post)
Bait used: Nightcrawler, Wheatie Balls, Cut Bluegill
7-28-2011
Ohio River
5pm to 1:30am, 8.5 Hours, Clear
1 Channel Cats (8lbs 10oz) 3 Drum (2 less than 1lb.,1lb 5oz)
15 Points
Bait Used: Nightcrawler, cut shad
After a year of fishing we typically had 80 or so trips and we found that by using this method it was possible to compare trips but a lot of hand calculating had to be done. Therefore we eventually switched to our current log format....Microsoft Excel.
As mentioned above we currently use Microsoft excel as our primary program to keep and analyze our fishing logs. We have found that by using a row as an individual fishing trip we can compare our data much more easily. The columns allow each individual factor of a given trip to line up with the same factor of other trips. This is helpful when comparing lets say number of fish caught between location a and location b. Microsoft Excel is also a very powerful program when it comes to computing formulas, analyzing patterns, etc. Since this post is just basics, we'll cover the essentials, and then the more complex things in another post.
To begin lets start by opening Microsoft Excel, my version is 2010, so many of yours may look slightly different. However the processes are the same. (Feel free to follow along if you have Microsoft excel.) At the bottom right hand corner there is a slider that allows you to zoom in and out, for this log I chose to use a small number of columns so I zoomed in quite a bit.

Empty Spreadsheet in Excel
To begin start by adding titles to the first row, line of horizontal cells. For this walk-through I chose a few simple titles. Starting from left to right they are as follows: Date, Location, Start, Stop, Total Hours, Weather, Bluegill, Bass, Carp, Catfish, Fish Caught, Points Per Hour, and Bait. To add these titles simply click on the first collumn and begin typing, when your done hit the right arrow on your keyboard or select the next cell. Your spreadsheet should now look something like this.

The next step is to begin by filling in a fishing log. For the fist trip I chose to fill in the following data: 3/21/2008, My Pond, 5:00pm, 8:00pm, 3, Cloudy, 3, 5, 0, 0, 3 Bluegill, 5 Bass (1lb. 3oz), 8, 2.667, Black and Chart. Spinner Bait.

This needs a little explanation, under the fish caught title the cell should read 3 Bluegill, 5 Bass (1lbs. 3oz) This means that all bluegill were smaller than a half a pound....requirement for points, and that all but one bass was smaller than a pound. I use this format so that I don't have to keep track of all of the fish's weights, and in turn make the cell way longer than it has to be. The Points Per Hour column reads 2.667, this number is derived from the number of points divided by the number of hours spent. For this calculation I always use a calculator or do the math on paper. I choose not to use a formula here because it takes more time to create the formula than it does to actually just go ahead and do the math.
Now that we have a log in, we can begin to see that a few stylistic changes should be made. I chose to bold my tittles.To do this select the first row, this can be achieved by clicking on the "1" on the left had side to the left of the "Date" cell. Then above in the tools you will notice an area where you can change font/etc. here you will find the bold tool. It's represented by a large "B". You can also achieve this by selecting the desired cells and holding "Ctrl" and B on your keyboard. This is known as a short cut command. Here's where the bold function is located, and what your screen should now look like.

Now you can begin to add your next log. For this log format the cells as following: 4/16/2008, Rocky Fork Lake, 6:30pm, 2:30AM, 8, Clear, 8, 0, 2, 1, 8 Bluegill 2 Carp (3lbs. 2oz, 4lbs, 8oz) 1 Channel Cat (3lbs 3oz), 14, 1.75, NightCrawler, Wheatie balls. Here you will begin to notice that your Fish Caught column is getting cut off, to help with this try using abbreviations. I chose to use this instead: 8BG, 2CP(3lbs2oz, 4lbs8oz), 1CC(3lbs 3oz) Note the # sign can also be used instead of lbs. for those who catch more fish than others, or choose to keep track of more weights than others. Here is what your screen should look like at this point.

Now go ahead and format the next three trips to match the following image.

The next step is to utilize the functions of Excel to do a few calculations for your log. Here we will use formulas to obtain the total hours spent this year, total bluegill, total bass, total carp, total catfish, total points, and total points per hour. To begin start by adding a title for the column. In cell A9 Type the word TOTAL. Now move and select the cell E9, this should be the cell directly under the total hours column. Now click the formulas tab in the tool bar, and then select the autosum function. Shown below.

Once you click the autosum function your screen should look like this. The cell should now read =SUM (E2:E8). This formula is telling the program to add all of the numbers in columns E2 through E8.

Hit enter and the cell should now read 38. Note if you put the word hours after the number in the cells the computer will not recognize the number and will give an invalid output. Now move to cell G9 and select the autosum function again. Hit enter and your cell should now read 26. Do the same for the Bass column. Now move to the Carp column, you'll not here that when you select the auto sum feature it will opt to sum the row 9 totals, this is just the computers way of trying to be helpful. Picture shown below. Simply highlight the cells you want to select instead. Do this by dragging your mouse pointer to cell I2 and left clicking, holding the left clicker of the mouse drag the pointer to cell I8 and release. Hit enter and your cell should read =SUM (I2:I8), or 2 for the total carp.

Now do the same for the catfish column and the points column. When you get to the Points Per Hour column you will have to use a different formula. Summing the points per hour will give you a huge number instead of an average. Instead select cell M9 and hit the = sign. This tells the program that you want to now create a formula. Now select the total points cell, L9 and hit the / key. Then select the total hours cell, E9 and hit enter. You have just told the program to divide the total points by the total hours you have spent, thus giving you an average. Your cell should now read 2.223......

Now you have a basic idea of a few of the calculations Microsoft Excel can make, thus saving the angler time and allowing him to fish more. On this small scale it would be easy to do hand calculations, but imagine doing calculations for 113 trips and 16 separate species. That is precisely how many trips and species I logged last year. It can become very monotonous, and makes me appreciate programs such as Microsoft excel that much more.
Thanks,
Sean


